Processor bottleneck. Which processor will open the video card? Comparison with the standard
If you ask a modern person what the main parts a computer consists of, then, perhaps, he will give a rather long list, the first lines of which will be the system unit, keyboard and monitor. It is easy to guess that such a list is hardly suitable for characterizing a computer that controls a microwave oven, a car ignition system, or a spacecraft. In general, it has no more in common with reality than the statement that a crimson jacket is a distinctive feature of all vertebrates.
Any computer, regardless of its architectural features and purpose, consists of a central processor and RAM, which, if necessary, can be supplemented with peripheral devices. The latter are used mainly so that the computer can exchange information with the outside world. But in general, its performance is determined by the coordinated work of the processor and memory. And this is where a bottleneck has recently emerged.
The IBM PC, the first mass-produced 16-bit personal computer, which appeared a little over 20 years ago, used the Intel 8088 processor - the younger brother of the Intel 8086, which differs from it by a twice narrower external data bus. This decision was economically justified, as it allowed the use of eight-bit peripherals, so the new computer did not differ too much in price from its eight-bit counterparts. But if the previous Intel 8086 processor carried out synchronous fetching and execution of commands, then with the new processor these actions were performed asynchronously - a command queue appeared, which was filled when there was no intensive exchange of the processor with the data area. This made it possible to use the data bus bandwidth more efficiently, and reducing its width by half did not lead to a significant drop in performance.
At that time, the memory practically did not delay the execution of commands: the processor operated at a clock frequency of 4.77 MHz, and it even took much longer to calculate the address than the memory provided the necessary data. However, processor speed is characterized by clock speed, and memory speed is characterized by access time, which is not subject to such dizzying progress: clock speed has increased by almost 500 times, but access time has decreased by only about an order of magnitude. But if the access time is, say, 100 ns, then at 10 MHz this corresponds to one processor cycle, at 40 MHz - four clock cycles, and at 100 MHz - already ten. In addition, the architecture of processors was improved, so that the same instructions began to be executed in much fewer clock cycles (see Table 1).
The developers took into account emerging trends. The IBM PC AT came out with a full 16-bit data bus, and the IBM AT-386 with a full 32-bit one. The bit depth of computers on the 486 processor was the same. Further more. The width of the Pentium's external data bus was 64 bits, i.e. twice the processor's width. And for graphics processors (often called 3D accelerators) it is already 128-256 bits.
Increasing the bus width is not the only way to get around slow memory speeds. Starting with the older 386 models, computers began to use cache memory - a small amount of high-speed memory, which is like a buffer between the slow main memory and the processor.
Modern memory modules are designed to operate in a narrow frequency range, so their timing diagrams are optimized for only one, nominal frequency. Therefore, when using lower frequencies, memory performance will decrease proportionally.
Until recently, the frequency of the processor's external Front Side Bus (FSB) had to match the clock frequency of the RAM. The low bus frequency of Celeron processors (66 MHz) limited the performance of this class of processors. The latest chipsets allow memory to be clocked at a higher frequency, which can have a significant impact on overall performance. To study this issue, we used the Gigabyte GA-6VTX motherboard on the VIA Apollo Pro 133T chipset, which allows you to independently set both the external processor frequency and the RAM clock frequency. Two processors were installed on it in turn, differing in the frequency of the external bus: Celeron-566 (FSB 66 MHz) and Celeron-1000 (FSB 100 MHz). The set of tests is traditional for our magazine. All tests were carried out in a single-tasking OS (DOS Mode Windows 98 SE). Naturally, the cache memory was not turned off during measurements, which also had a significant influence (sometimes decisive, but more on that below) on the results.
When reading, writing and transferring a 4-MB array, quite certain patterns emerged (see Table 2).
Firstly, increasing the memory clock frequency from 100 to 133 MHz with a 66 MHz FSB did not lead to any change in the results. This is true not only for sequential access, but in general for all experiments performed. What is the matter here: either the FSB is not able to “digest” a more than one and a half times increase in the memory frequency, or the real clock frequency is “frozen” at 100 when the BIOS Setup shows 133 - it’s hard to say.
Secondly, the speed of performing a significant part of operations depends only on the memory frequency, and not on the processor frequency.
Thirdly, actually measured memory access speeds often turn out to be significantly lower than what could be expected based on simple estimates.
As an alternative to sequential access, random access can be used. Within a 32-MB area, an address was randomly calculated, and then one byte was read or written from that address (Figure 1).
The extremely low exchange rate is due to two factors. Firstly, it takes quite a lot of time to initially set the address (see sidebar). Secondly, read/write operations are buffered by the cache, and exchanges with it are carried out only in portions of 32 bytes. In other words, in order to read 1 byte from memory, it is necessary to transfer it to cache 32. In conclusion, I note that the procedure for calculating a random address, of course, also takes some time, however, the applied algorithm allows, when the data volume is reduced to the size of the L2 cache, to be sampled at a speed more than 70 MB/s for the 1 GHz processor used.
The different nature of the dependence of performance on processor and memory frequency for different types of applications can be seen in Fig. 2.

For consistency, the unit of performance is taken to be a processor with a frequency of 566 MHz and memory operating at 66 MHz. The following test programs are indicated by the curves:
- Solving a system of partial differential equations (PDDE) on a 566 MHz processor with a data volume of 40 MB.
- Solution of the SDE on a 1000 MHz processor under the same conditions.
- Finding prime numbers using the “Sieve of Eratosthenes” (SE) method on a 566 MHz processor with an array size of 40 MB.
- RE on a 1000 MHz processor with the same array volume.
- Fast sorting of a 16 MB array on a 566 MHz processor.
- Fast sorting of a 16 MB array on a 1 GHz processor.
- Finding the shortest path in a graph using Dijkstra's method on a 566 MHz processor. The volume of the arrays is 300 KB (more than double the cache memory).
- Finding the shortest path in a graph on a 1 GHz processor under the same conditions.
From the data presented it is clear that most applications are most sensitive to processor frequency. In Fig. 2 they correspond to horizontal curves near unity for a frequency of 566 MHz and near 1.7-1.8 for 1000 MHz. The “sieve of Eratosthenes” turned out to be the most sensitive to memory frequency, while with 66 MHz memory performance was practically independent of processor frequency. The graphs for such applications look like sloping lines, for which doubling the frequency corresponds to the same increase in performance, while there is no dependence on the processor frequency. Some compromise is observed when solving a system of differential equations. Performance depends on memory frequency, but not directly proportional, but much weaker, in addition, at a memory frequency of 66 MHz, the 1 GHz Celeron processor demonstrates only a quarter higher performance compared to 566 MHz.
I would like to make a comparison using the example of another task, and also explore the influence of cache memory.
In those early days, when computers occupied several floors of a building and were used exclusively for scientific calculations, a lot of attention was already paid to performance measurement. True, there were no memory-related delays then, and floating point calculations were considered the most complex. It is for such calculations that the Dongarra test was written - solving a system of linear equations. The results of some generalization of this test are shown in Fig. 3. It has now turned out that floating point calculations themselves can be performed much faster than writing the results of these calculations into memory.

The low performance with small arrays is explained by the fact that modern superscalar processors with a pipeline architecture perform well in a continuous sequence of instructions, while loops and procedure calls are somewhat worse, and the overhead for these operations increases as the size of the arrays decreases. Until the data volume reaches the cache size, performance increases, and is determined solely by the processor frequency. When the cache is full, we see a sharp drop in performance, reaching tenfold. In this case, the curves in the transition region first diverge and then converge again, but according to a completely different criterion - according to the memory frequency. The processor clock speed loses its role, and the memory frequency comes to the fore.
Fortunately, a significant portion of real-life applications do not reach such volumes of simultaneously processed data that the processor clock speed ceases to matter. The texture processing required on each frame is taken over by the graphics processor, and there the frequencies and bus width are completely different. And other voluminous data, be it a video, an archive or a multi-page document, as a rule, is processed in small portions that fit into the cache memory. But on the other hand, the cache memory also needs to be filled. And a decrease in productivity “only” by two or three times or even by tens of percent instead of ten times can hardly be a consolation.
Another conclusion follows from the measurements: if the chipset allows asynchronous operation of the processor and memory, this will neutralize the difference in performance due to the difference in the FSB, which is found, for example, in Celeron and Pentium!!!.
From the editor: Although the conclusions obtained can confidently be attributed only to boards based on the VIA Apollo 133T chipset, in general this approach can be applied to assess the effectiveness of the transition to the 533-MHz bus in modern boards.
How does dynamic memory work?
The central part of the dynamic memory chip is an MxN array of capacitors, where M and N are usually equal to some power of two. Each capacitor can be in one of two states: charged or discharged, so it stores 1 bit of information.
The address is transferred to the memory chip in two stages: first, the lower half of the address is fixed in the address register by the RAS signal (row address strobe), and then the higher half by the CAS signal (column address strobe). When reading data from memory after fixation, the low-order part of the address is fed to the row decoder, and from it to the matrix, as a result of which the entire row of matrix capacitors is connected to the input of the readout amplifiers. During the reading process, the capacitors are discharged, which means that the information in the matrix is lost. To prevent this, the just read line of data is written again to the line of matrix capacitors - memory regeneration occurs. By the time a row from the matrix reaches the buffer of the readout amplifier, the high half of the address has already been supplied to the column address decoder and with the help of this decoder, a single bit of information stored at the address recorded in the address register is selected. After this, the read data can be sent to the output of the microcircuit. When writing information, first the line is also read in its entirety, then the required bit in it is changed and the line is written to its original place. Increasing the bit capacity to 1, 2, 4 or 8 bytes is achieved by parallel operation of several memory chips or several matrices in one chip.
As you can see, to access a dynamic memory cell you need to perform many sequential operations, and therefore the access time turns out to be quite long - today it is 35-50 ns, which corresponds to 5-7 clock cycles of the external bus.
Memory operating as described above (DRAM - dynamic random access memory) was used in the first personal computers. In this case, a volume of information of up to 64 kbit was stored in one case. But if address operations inevitably take a long time, is there any way to get around this limitation? After all, the processor often needs long chains of bytes stored in memory in a row, for example, when executing a sequence of commands or when processing strings and arrays of data. And a solution was found: after transmitting the address of the first element to the microcircuit, several subsequent elements were read only using control bus signals, without transmitting a new address, which turned out to be approximately twice as fast. This memory was called FPM RAM (fast page memory) and for a long time became the only type of RAM used in personal computers. Sequences of numbers were used to indicate the timing characteristics of such memory: for example, “7-3-3-3” meant that it would take 7 system bus clock cycles to receive the first piece of data, and 3 clock cycles for subsequent ones. However, the processor clock frequency differs from the frequency system bus, on the one hand, and the progress of technology, which has made it possible to reduce the number of clock cycles consumed by a computing unit for one operation, on the other, raised the question of further improvement of RAM technology.
The next stage was the development of EDO RAM - memory with increased data output time, when it became possible to combine the receipt of the next data block with the transmission of a “request” to receive the next one. This made it possible to reduce the access time by one clock cycle: “6-2-2-2”. However, EDO RAM was very soon supplanted by SD RAM (synchronous) memory; by interleaving blocks, it was possible to reduce the access time to “5-1-1-1-1-1-1-1”. At the same time, a certain marketing ploy was applied: if when designating the access time to memory such as FPM and EDO RAM, it was customary to indicate the time of the first access, which was 60-80 ns, then for SD RAM they began to indicate the time of the second and subsequent ones, which was already 10-12 ns for the same clock frequencies and therefore similar first access times. At the same time, the performance of the memory subsystem increased by tens of percent, while the numbers indicating memory access time decreased several times.
SDRAM is still the main type of memory for Intel Pentium processors!!! and Celeron. Along with it, newer developments can also be used: DDR RAM (more precisely, DDR SDRAM, but we will use the indicated designation), used mainly with AMD Athlon and Duron processors, operating at the same frequencies (100-133 MHz), but allowing transmit data up to two times per clock: on the rising and falling edges (therefore, such a thing as an effective frequency appeared, in this case 200-266 MHz), and focused on use in systems with Pentium-4 RDR RAM (Rambus RAM), operating at frequencies 300-533 MHz (effective frequency 600-1066 MHz).
If for SDRAM (now often called SDR DRAM) the designations PC-100 and PC-133 were adopted, meaning the ability to operate at 100 and 133 MHz, respectively, then for new types of memory, say PC-2100, the numbers no longer indicate a frequency of more than 2 GHz , but only the “peak” data transfer rate. The word “peak” is put in quotation marks because, no matter what ideal conditions we carry out measurements, the resulting ratio of the amount of information transmitted to the time spent on it will not only not be equal to the indicated numbers, but will not even tend to them asymptotically. The fact is that this speed is given for part of the packet with the first portion of data cut off, i.e., as for SDRAM, only for the “second and subsequent ones”. For DDR RAM, the first access time is the same as for SDRAM, and subsequent access times are half as long. Therefore, with sequential access, the performance gain is tens of percent, and with random access, there is no gain at all.

The latest version of Windows has added a feature to determine power ratings for different PC components. This gives an overview of the performance and bottlenecks of the system. But here you will not find any details about the speed parameters of the components. In addition, this diagnostic does not allow you to perform a hardware stress test, which can be useful for understanding peak loads during the launch of modern games. Third-party benchmarks of the 3DMark family also provide only estimates in conditional points. It is no secret that many computer hardware manufacturers optimize the operation of video cards and other components in such a way as to get the maximum number of points when passing 3DMark. This program even allows you to compare the performance of your equipment with similar ones from its database, but you will not get specific values.
Therefore, PC testing should be done separately, taking into account not only the performance assessment by the benchmark, but also the actual technical characteristics recorded as a result of testing the equipment. We have selected for you a set of utilities (both paid and free) that allow you to get specific results and identify weak links.
Image processing speed and 3D
Testing video cards is one of the most important steps when assessing PC power. Manufacturers of modern video adapters equip them with special software and drivers that allow the GPU to be used not only for image processing, but also for other calculations, for example, when encoding video. Therefore, the only reliable way to find out how efficiently computer graphics are processed is to resort to a special application that measures the performance of the device.
Checking video card stability
Program: FurMark 1.9.1 Website: www.ozone3d.net The FurMark program is one of the fastest and easiest tools for checking the operation of a video adapter. The utility tests the performance of a video card using OpenGL technology as a basis. The proposed visualization algorithm uses multi-pass rendering, each layer of which is based on GLSL (OpenGL shader language).
To load the graphics card's processor, this benchmark renders an abstract 3D image with a torus covered in fur. The need to process a large amount of hair leads to the maximum possible load on the device. FurMark checks the stability of the video card and also shows changes in the temperature of the device as the load increases.
In the FurMark settings, you can specify the resolution at which the hardware will be tested, and upon completion, the program will present a brief report on the PC configuration with a final score in conditional points. This value is convenient to use when comparing the performance of several video cards in general. You can also check the “standby” resolutions of 1080p and 720p.
Virtual stereo walk
Program: Unigine Heaven DX11 Benchmark Website: www.unigine.com One of the surest ways to test what a new computer can do is to run games on it. Modern games fully utilize hardware resources - video card, memory and processor. However, not everyone has the opportunity and desire to spend time on such entertainment. You can use Unigine Heaven DX11 Benchmark instead. This test is based on the Unigine game engine (games such as Oil Rush, Dilogus: The Winds of War, Syndicates of Arkon and others are built on it), which supports graphics APIs (DirectX 9, 10, 11 and OpenGL). After launching it, the program will create a demo visualization, drawing the virtual environment in real time. The user will see a short video that will include a virtual walk through a fantasy world. These scenes are created by the video card. In addition to three-dimensional objects, the engine simulates complex lighting, simulating a global system with multiple reflections of light rays from scene elements.
You can test your computer in stereo mode, and in the benchmark settings you can select a surround video image standard: anaglyph 3D, separate frame output for the right and left eyes, etc.
Despite the fact that the title of the program mentions the eleventh version of DirectX, this does not mean that Unigine Heaven is intended only for modern video cards. In the settings of this test, you can select one of the earlier versions of DirectX, as well as set an acceptable level of picture detail and specify the quality of shader rendering.
Finding the weak link
In a situation where a user is overwhelmed by the desire to increase the performance of his computer, the question may arise: which component is the weakest? What will make the computer faster - replacing the video card, processor or installing a huge amount of RAM? To answer this question, it is necessary to test individual components and determine the “weak link” in the current configuration. A unique multi-testing utility will help you find it.
Load simulator
Program: PassMark PerformanceTest Website: www.passmark.com PassMark PerformanceTest analyzes almost any device present in the PC configuration - from the motherboard and memory to optical drives.
A special feature of PassMark PerformanceTest is that the program uses a large number of different tasks, scrupulously measuring computer performance in different situations. At a certain moment, it may even seem that someone has taken control of the system into their own hands - windows open randomly, their contents are scrolled, and images are displayed on the screen. All this is the result of a benchmark that simulates the execution of the most typical tasks usually required in Windows. At the same time, the speed of data compression is checked, the time required to encrypt information is recorded, filters are applied to photographs, the rendering speed of vector graphics is set, short 3D demo videos are played, etc.
At the end of testing, PassMark PerformanceTest provides a total score and offers to compare this result with data obtained on PCs with different configurations. For each of the tested parameters, the application creates a diagram on which the weak components of the computer are clearly visible.
Checking the disk system
Disk system throughput can be the biggest bottleneck in PC performance. Therefore, knowing the real characteristics of these components is extremely important. Testing a hard drive will not only determine its read and write speeds, but will also show how reliably the device operates. To check your drive, we recommend trying two small utilities.
Exams for HDD
Programs: CrystalDiskInfo and CrystalDiskMark Website: http://crystalmark.info/software/index-e.html These programs were created by the same developer and complement each other perfectly. Both of them are free and can work without installation on a computer, directly from a flash drive.
Most hard drives implement SMART self-diagnosis technology, which allows you to predict possible malfunctions in the drive. Using the CrystalDiskInfo program, you can assess the real state of your HDD in terms of reliability: it reads SMART data, determines the number of problem sectors, the number of read head positioning errors, the time required to spin up the disk, as well as the current temperature of the device. If the latter indicator is too high, then the service life of the media before failure will be very short. The program also shows the firmware version and provides data on the duration of use of the hard drive.
CrystalDiskMark is a small application that measures write and read speeds. This disk checking tool differs from similar utilities in that it allows you to use different conditions for writing and reading data - for example, measuring readings for blocks of different sizes. The utility also allows you to set the number of tests to be performed and the amount of data used for them.
Speedometer for web surfing
The actual speed of a network connection usually differs from that indicated in its settings or declared by the provider, and, as a rule, to a lesser extent. The speed of data transfer can be influenced by a lot of factors - the level of electromagnetic interference in the room, the number of users simultaneously working on the network, cable quality, etc.
Network Speed Estimate
Program: SpeedTest Website: www.raccoonworks.com If you want to find out the real data transfer speed on your local network, the SpeedTest program will help you. It allows you to determine whether the provider adheres to the stated parameters. The utility measures the data transfer speed between two working user machines, as well as between a remote server and a personal computer.
The program consists of two parts - server and client. To measure the speed of information transfer from one computer to another, the first user needs to launch the server part and specify an arbitrary file (preferably large) that will be used for the test. The second test participant must launch the client component and specify the server parameters - address and port. Both applications establish a connection and begin exchanging data. During the file transfer process, SpeedTest plots a graphical relationship and collects statistics about the time it took to copy the data over the network. If you test several remote PCs, the program will add new curves to the plotted graph over and over again.
In addition, SpeedTest will check the speed of the Internet: in “Web Page” mode, the program tests the connection to any site. This parameter can also be assessed by going to the specialized resource http://internet.yandex.ru.
Malfunctions in RAM may not appear immediately, but under certain loads. To be sure that the selected modules will not let you down in any situation, it is better to test them thoroughly and choose the fastest ones.
Meme Olympics
Program: MaxxMEM2 - PreView Website: www.maxxpi.net This program is designed to test memory speed. In a very short period, it performs several tests: it measures the time it takes to copy data into RAM, determines the speed of reading and writing data, and shows the memory latency parameter. In the utility settings, you can set the test priority, and compare the result with the current values obtained by other users. From the program menu, you can quickly go to online statistics on the official MaxxMEM2 website and find out which memory is the most productive.
For sound, speed is not important
When testing most devices, data processing speed is usually important. But with regard to the sound card, this is not the main indicator. It is much more important for the user to check the characteristics of the analog and digital audio path - to find out how much the sound is distorted during playback and recording, measure the noise level, etc.
Comparison with the standard
Program: RightMark Audio Analyzer 6.2.3 Website: http://audio.rightmark.org The creators of this utility offer several ways to check audio performance. The first option is self-diagnosis of the sound card. The device reproduces a test signal through the audio path and immediately records it. The waveform of the received signal should ideally match the original. Deviations indicate sound distortion by the audio card installed in your PC.
The second and third testing methods are more accurate - using a reference audio signal generator or using an additional sound card. In both cases, the quality of the signal source is taken as the standard, although additional devices also introduce a certain error. When using a second audio card, the output signal distortion factor should be minimal - the device should have better characteristics than the sound card being tested. At the end of the test, you can also determine parameters such as the frequency characteristics of the audio card, its noise level, harmonic distortion output, etc.
In addition to the basic functions available in the free edition, the more powerful version of RightMark Audio Analyzer 6.2.3 PRO also includes support for a professional ASIO interface, four times more detailed spectrum resolution and the ability to use direct Kernel Streaming data transfer.
It is important that no one interferes
When running any performance test, keep in mind that the final results are affected by many factors, especially the performance of background services and applications. Therefore, for the most accurate assessment of your PC, it is recommended to first disable the anti-virus scanner and close all running applications, including the email client. And, of course, to avoid errors in measurements, you should stop all work until the program completes testing the equipment.
The theory of system limitations was formulated in the 80s of the twentieth century. and concerned the management of manufacturing enterprises. Briefly, its essence boils down to the fact that in every production system there are restrictions that limit efficiency. If you eliminate a key limitation, the system will work much more efficiently than if you try to influence the entire system at once. Therefore, the process of improving production must begin with eliminating bottlenecks.
Now the term bottleneck can be used in any industry - in the service sector, software development, logistics, everyday life.
What is bottleneck
The definition of bottleneck is a place in a production system where congestion occurs because materials are flowing in too quickly but cannot be processed as quickly. This is often a station with less power than the previous node. The term comes from an analogy with the narrow neck of a bottle, which slows down the flow of liquid out.

Bottleneck - bottleneck in the production process
In manufacturing, the bottleneck effect causes downtime and production costs, reduces overall efficiency and increases delivery times to customers.
There are two types of bottlenecks:
- Short term bottlenecks- caused by temporary problems. A good example is sick leave or vacation of key employees. No one on the team can fully replace them, and work stops. In production, this may be a breakdown of one of a group of machines when its load is distributed among the working equipment.
- Long-term bottlenecks- act constantly. For example, a constant delay in monthly reports in a company due to the fact that one person must process a huge amount of information that will arrive to him in an avalanche at the very end of the month.
How to identify bottleneck in production process
There are several ways to search for bottlenecks in production of varying levels of complexity, with or without the use of special tools. Let's start with simpler methods based on observation.
Queues and congestion
The process on a production line that has the largest queue of work-in-process units in front of it is usually a bottleneck. This bottleneck search method is suitable for piece-by-piece conveyor production, for example, on a bottling line. It is clearly visible where bottles accumulate in the line, and which mechanism has insufficient power, often breaks down, or is serviced by an inexperienced operator. If there are several congestion points on the line, then the situation is more complicated, and additional methods must be used to find the most critical bottleneck.
Bandwidth
The throughput of the entire production line directly depends on the output of the bottleneck equipment. This characteristic will help you find the main bottleneck of the production process. Increasing the output of a piece of equipment that is not a bottleneck will not significantly affect the overall output of the line. By checking all the equipment one by one, you can identify the bottleneck - that is, the step whose power increase will most affect the output of the entire process.
Full power
Most production lines track the utilization percentage of each piece of equipment. Machines and stations have a fixed capacity and are used at a certain percentage of the maximum capacity during the production process. The station that uses maximum power is bottleneck. Such equipment constrains the percentage of power utilization of other equipment. If you increase the bottleneck power, the power of the entire line will increase.
Expectation
The production process also takes into account downtime and waiting times. When there is a bottleneck on the line, the equipment that goes directly to it sits idle for a long time. Bottleneck delays production and the next machine does not receive enough material to operate continuously. When you find a machine with a long wait time, look for the bottleneck in the previous step.
In addition to monitoring production, the following tools are used to identify bottlenecks:
Value Stream Mapping - map of creating value streams
Once you understand the cause or causes of bottlenecks, you need to determine actions to expand the bottleneck and increase production. You may need to relocate employees to the problem area or hire additional staff and equipment.
Bottlenecks can occur where operators reconfigure equipment to produce a different product. In this case, you need to think about how to reduce downtime. For example, changing the production schedule to reduce the number of changeovers or reduce their impact.
How to reduce the impact of bottlenecks
Bottleneck Management suggests manufacturing companies take three approaches to reduce the impact of bottlenecks.
First approach
Increasing the capacity of existing bottlenecks.
There are several ways to increase the capacity of bottlenecks:
- Add resources to the limiting process. It is not necessary to hire new employees. Cross-functional staff training can reduce the impact of bottlenecks at little cost. In this case, workers will service several stations at once and facilitate the passage of bottlenecks.
- Ensure uninterrupted supply of parts to the bottleneck. Always keep an eye on the work-in-process before the bottleneck, manage the flow of resources to the bottleneck station, take into account overtime, during which the equipment must also always have parts to process.
- Make sure the bottleneck only works with quality parts. Don't waste power and bottleneck time on scrap processing. Place quality control points in front of bottleneck stations. This will increase the throughput of the process.
- Check the production schedule. If a process produces several different products that require different bottleneck times, adjust the production schedule so that the overall bottleneck demand decreases
- Increase the operating time of limiting equipment. Let bottleneck last longer than other equipment. Assign an operator to service the process during lunch breaks, scheduled downtime and, if necessary, overtime. Although this method will not reduce cycle time, it will keep the bottleneck running while the rest of the equipment is idle.
- Reduce downtime. Avoid planned and unplanned downtime. If the bottleneck equipment fails during the operating process, immediately send a repair team to repair it and get it running. Also try to reduce the time it takes to change equipment from one product to another.
- Improve the process at the bottleneck. Use VSM to eliminate non-value-adding activities and reduce time to add value while eliminating waste. The end result is faster cycle times.
- Redistribute the load on the bottleneck. If possible, split the operation into parts and assign them to other resources. The result is shorter cycle times and increased power.

Second approach
Sale of surplus production produced by non-bottleneck equipment.
For example, you have 20 injection presses on your line, but you only use 12 of them because the bottleneck equipment cannot process the output of all 20 presses. In this case, you can find other companies that are interested in subcontracting injection molding operations. You will be profitable because you will receive more from subcontractors than your variable costs.
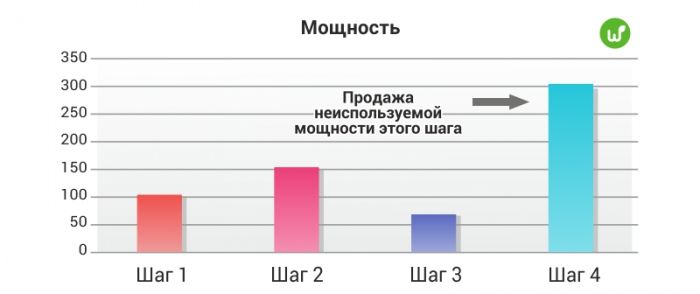
Third approach
Reduce unused power.
The third option for optimizing production is to sell off equipment with extra capacity and reduce or relocate the personnel who service it. In this case, the power of all equipment will be equalized.

Examples of bottleneck outside of production
Transport
A classic example is traffic jams, which can constantly form in certain places, or appear temporarily during an accident or road work. Other examples are a river lock, a forklift, a railway platform.
Computer networks
A slow WiFi router connected to an efficient, high-bandwidth network is a bottleneck.
Communication
A developer who spends six hours a day in meetings and only two hours writing code.
Software
Applications also have bottlenecks - these are code elements where the program “slows down”, forcing the user to wait.
Computer hardware
Computer bottlenecks are hardware limitations in which the power of the entire system is limited to a single component. Often the processor is seen as the limiting component for the graphics card.
Bureaucracy
In everyday life, we often encounter bottlenecks. For example, when forms for passports or driver's licenses suddenly run out and the entire system stops. Or when you need to undergo a medical examination, but the fluorography room is open only three hours a day.
Verdict
Bottlenecks in production, management and life are points of potential improvement.
Extending the bottleneck will provide a significant increase in productivity and efficiency.
And not paying attention to the limiting elements of the system means not making enough profit and working below your capabilities.
Good day!
A good day, nothing foreshadowed anything bad. But then a problem came - the speed of some application became unacceptably slow, and just a week/month/day ago everything was fine. It must be solved quickly, spending as little time as possible. The problematic server is based on Windows Server 2003 or later.
I hope the following writing will be quite short and understandable and, moreover, useful both for novice administrators and for more serious comrades, because you can always find something new for yourself. Don't immediately rush to investigate the application's behavior. First of all, it’s worth looking at whether the server’s performance is sufficient at the moment? Are there any bottlenecks that limit its performance?
Perfmon will help us with this - a fairly powerful tool that comes with Windows. Let's start by defining a “bottleneck” - a resource that has reached its limit of use. They usually occur due to incorrect resource scheduling, hardware problems, or incorrect application behavior.
If we open perfmon, we will see dozens and hundreds of various sensors, and the number of them is not conducive to a quick investigation of this problem. So, first, let’s highlight 5 main possible “bottlenecks” in order to reduce the list of sensors under study.
These will be the processor, RAM, storage system (HDD/SSD), network and processes. Next we will look at each of these points, what sensors we will need and the threshold values for them.
CPU
A processor overloaded with tasks clearly does not contribute to fast application performance. To study its resources, we will highlight only 4 sensors:
Processor\% Processor Time
Measures the ratio of processor time to idle time as a percentage. The most understandable sensor is processor load. MS recommends changing the processor to a faster one if the value is above 85%. But this depends on many factors; you need to know your needs and characteristics, since this value may vary.
Processor\% User Time
Shows how much time the processor spends in user space. If the value is large, it means that applications are taking up a lot of CPU time, it is worth taking a look at them, because there is a need to optimize them.
Processor\% Interrupt Time
Measures the time the processor spends waiting for a response to an interrupt. This sensor can indicate the presence of hardware problems. MS recommends starting to worry if this value exceeds 15%. This means that some device is starting to respond very slowly to requests and should be checked.
System\Processor Queue Length
Shows the number of threads in the queue waiting for their execution time. MS recommends thinking about changing the processor to one with a larger number of cores if this value exceeds the number of cores multiplied by two.
RAM
Insufficient RAM can greatly impact overall system performance, forcing the system to actively use the slow HDD for swapping. But even if the server seems to have a lot of RAM installed, memory can leak. A memory leak is an uncontrolled process of reducing the amount of free memory associated with errors in programs. It is also worth mentioning that for Windows, the amount of virtual memory is the sum of RAM and the page file.
Memory\% Committed Bytes in Use
Shows virtual memory usage. If the value exceeds 80%, then you should think about adding RAM.
Memory\Available Mbytes
Shows RAM usage, namely the number of megabytes available. If the value is less than 5%, then again you should think about adding RAM.
Memory\Free System Page Table Entries
The number of free page table elements. But it is limited, in addition, these days pages of 2 or more MB are gaining popularity, instead of the classic 4kB, which does not contribute to their large number. A value less than 5000 may indicate a memory leak.
Memory\Pool Non-Paged Bytes
The size of this pool. This is a piece of kernel memory that contains important data and cannot be swapped out. If the value exceeds 175 MB, then most likely it is a memory leak. This is usually accompanied by the appearance of events 2019 in the system log.
Memory\Pool Paged Bytes
Similar to the previous one, but this area can be swapped to disk if they are not used. For this counter, values above 250 MB are considered critical, usually accompanied by the appearance of events 2020 in the system log. Also indicates a memory leak.
Memory\Pages per Second
The number of requests (writing/reading) to page file per second due to the lack of necessary data in RAM. Again, a value greater than 1000 hints at a memory leak.
HDD
Quite an important element that can make a significant contribution to system performance.
LogicalDisk\% Free Space
Percentage of free space. We are only interested in partitions containing system files - OS, swap file/files, etc. MS recommends taking care of increasing disk space if there is less than 15% free space left, since under critical loads it can run out abruptly (temp files, Windows updates, or the same page file). But, as they say, “it depends” and you need to look at the actually available size of space, because... the same swap file can be strictly fixed, quotas are imposed on temps that prohibit them from growing, and updates are distributed piecemeal and rarely, or there are none at all.
PhysicalDisk\%Idle Time
Shows how long the disk has been idle. It is recommended to replace the disk with a more efficient one if this counter is below the 20% limit.
PhysicalDisk\Avg. Disk Sec/Read
The average time it takes a hard drive to read data from itself. Above 25ms is already bad; for SQL server and Exchange, 10ms or less is recommended. The recommendation is identical to the previous one.
PhysicalDisk\Avg. Disk Sec/Write
Identical to PhysicalDisk\Avg. Disk Sec/Read, write only. The critical threshold is also 25ms.
PhysicalDisk\Avg. Disk Queue Length
Shows the average number of I/O operations waiting for the hard drive to become available to them. It is recommended to start worrying if this number is twice the number of spindles in the system (in the absence of raid arrays, the number of spindles is equal to the number of hard drives). The advice is the same - a more productive HDD.
Memory\Cache Bytes
The amount of memory used for cache, part of which is file cache. A volume of more than 300MB may indicate a problem with HDD performance or the presence of an application that actively uses the cache.
Net
In the modern world, there is nowhere without it - a huge amount of data is broadcast over the network.
Network Interface\Bytes Total/Sec
The amount of data transmitted (send/receive) through the network adapter. A value greater than 70% of the interface's bandwidth indicates a possible problem. You need to either replace the card with a more powerful one, or add another one to offload the first one.
Network Interface\Output Queue Length
Shows the number of packets queued to be sent. If the value exceeds 2, then you should think about replacing the card with a more productive one.
Processes
Server performance can drop catastrophically if there is an unoptimized application or the application begins to behave incorrectly.
Process\Handle Count
The number of handles processed by the process. These can be both files and registry keys. A number of them exceeding 10,000 may indicate that the application is not working properly.
Process\Thread Count
The number of threads within the process. It’s worth taking a closer look at the application’s behavior if the difference between the minimum and maximum numbers exceeds 500.
Process\Private Bytes
Shows the amount of memory allocated by a process that cannot be shared with other processes. If the fluctuation of this indicator exceeds 250 between the minimum and maximum, then this indicates a possible memory leak.
Most of the above counters do not have a clear indicator that a “bottleneck” has appeared in the system. All given values were based on average statistical results and can vary for different systems over a wide range. To use these counters correctly, we must know at least the performance of the system during normal operation. This is called baseline performance - a perfmon log taken from a working, freshly installed (the latter is not necessary, it is never too late to remove this log or keep track of changes in baseline performance in the long term) system that does not have problems. This is a fairly important point, often omitted by many, although in the future it can seriously reduce the possible downtime of the system and explicitly speed up the analysis of the data obtained from the above counters.
Taken from https://ru.intel.com/business/community/?automodule=blog&blogid=57161&sh...
0 0Technological progress does not move evenly in all areas, this is obvious. In this article we will look at which nodes at which times improved their characteristics more slowly than others, becoming a weak link. So, today's topic is the evolution of weak links - how they arose, influenced, and how they were eliminated.
CPU
Since the earliest personal computers, the bulk of computing has been done by the CPU. This was due to the fact that the chips were not very cheap, so most of the peripherals used processor time for their needs. And there were very few peripheries at that time. Soon, with the expansion of the scope of PC applications, this paradigm was revised. The time has come for various expansion cards to flourish.
In the days of “kopecks” and “threes” (these are not Pentiums II and III, as young people might think, but i286 and i386 processors), the tasks assigned to the systems were not very complex, mainly office applications and calculations. Expansion cards already partly relieved the processor; for example, the MPEG decoder, which decrypted files compressed in MPEG, did this without the participation of the CPU. A little later, standards began to be developed that would put less load on the processor when exchanging data. An example was the PCI bus (which appeared starting with the i486), the operation of which put less load on the processor. Such examples also include PIO and (U)DMA.
Processors increased their power at a good pace, a multiplier appeared, since the speed of the system bus was limited, and a cache appeared to mask requests into RAM operating at a lower frequency. The processor was still the weak link, and the speed of operation depended almost entirely on it.
Meanwhile, Intel, after releasing a good Pentium processor, is releasing a new generation - Pentium MMX. She wanted to change things up and move the calculations to the processor. The MMX - MultiMedia eXtensions instruction set, which was intended to speed up work with audio and video processing, helped a lot with this. With its help, MP3 music began to play normally, and it was possible to achieve acceptable MPEG4 playback using the CPU.
The first plugs in the tire
Systems based on the Pentium MMX processor were already more limited by memory bandwidth (memory bandwidth). The 66 MHz bus for the new processor was a bottleneck, despite the transition to a new type of SDRAM memory, which improved performance per megahertz. For this reason, bus overclocking became very popular, when the bus was set to 83 MHz (or 75 MHz) and received a very noticeable increase. Often, even a lower final processor frequency was compensated by a higher bus frequency. For the first time, higher speeds were achieved at lower frequencies. Another bottleneck was the amount of RAM. For SIMM memory this was a maximum of 64 MB, but more often it was 32 MB or even 16. This greatly complicated the use of programs, since each new version of Windows, as you know, likes to “eat a lot of tasty frames” (c). Recently there are rumors about a conspiracy between memory manufacturers and Microsoft Corporation.
Intel, meanwhile, began to develop the expensive and therefore not very popular Socket8 platform, while AMD continued to develop Socket7. Unfortunately, the latter used slow FPU (Floating Point Unit- a module for operations with fractional numbers), created by the then newly acquired company Nexgen, which entailed a lag behind the competitor in multimedia tasks - primarily games. The transfer to a 100 MHz bus gave the processors the necessary bandwidth, and the full-speed 256 KB L2 cache on the AMD K6-3 processor improved the situation so much that now the system speed was characterized only by the processor frequency, and not the bus. Although, in part, this was due to the slow FPU. Office applications that depended on ALU power ran faster than competing solutions thanks to the fast memory subsystem.
Chipsets
Intel abandoned the expensive Pentium Pro, which had an L2 cache die integrated into the processor, and released the Pentium II. This CPU had a core very similar to the Pentium MMX core. The main differences were the L2 cache, which was located on the processor cartridge and operated at half the core frequency, and the new bus - AGTL. With the help of new chipsets (in particular, i440BX), it was possible to increase the bus frequency to 100 MHz and, accordingly, bandwidth. In terms of efficiency (the ratio of random read speed to theoretical), these chipsets became one of the best, and to this day Intel has not been able to beat this indicator. The i440BX series chipsets had one weak link - the south bridge, the functionality of which no longer met the requirements of that time. The old south bridge from the i430 series, used in systems based on Pentium I, was used. It was this circumstance, as well as the connection between the chipsets via the PCI bus, that prompted manufacturers to release hybrids containing the i440BX north bridge and the VIA (686A/B) south bridge.
Meanwhile, Intel is demonstrating DVD movie playback without support cards. But the Pentium II did not receive much recognition due to its high cost. The need to produce cheap analogues became obvious. The first attempt - an Intel Celeron without L2 cache - was unsuccessful: in terms of speed, the Covingtons were very much inferior to their competitors and did not justify their prices. Then Intel makes a second attempt, which turned out to be successful - the Mendocino core, loved by overclockers, with half the cache size (128 KB versus 256 KB for the Pentium II), but operating at twice the frequency (at the processor frequency, not half as slow as the Pentium II). Due to this, the speed in most tasks was no lower, and the lower price attracted buyers.
The first 3D and again the bus
Immediately after the release of the Pentium MMX, the popularization of 3D technologies began. At first these were professional applications for developing models and graphics, but the real era was opened by 3D games, or more precisely, the Voodoo 3D accelerators created by 3dfx. These accelerators became the first mainstream cards for creating 3D scenes, which relieved the processor during rendering. It was from this time that the evolution of three-dimensional games began. Quite quickly, scene calculations using the central processor began to lose to those performed using video accelerators, both in speed and quality.
With the advent of a new powerful subsystem - the graphics subsystem, which began to compete with the central processor in terms of the volume of calculated data - a new bottleneck emerged - the PCI bus. In particular, Voodoo 3 and older cards received an increase in speed simply by overclocking the PCI bus to 37.5 or 41.5 MHz. Obviously, there is a need to provide video cards with a fast enough bus. Such a bus (or rather, a port) became AGP - Accelerated Graphics Port. As the name suggests, this is a dedicated graphics bus, and according to the specification, it could only have one slot. The first version of AGP supported AGP 1x and 2x speeds, which corresponded to single and double PCI 32/66 speeds, that is, 266 and 533 MB/s. The slow version was added for compatibility, and it was with it that problems arose for quite a long time. Moreover, there were problems with all chipsets, with the exception of those released by Intel. According to rumors, these problems were related to the presence of a license only from this company and its obstruction of the development of the competing Socket7 platform.
AGP has improved things and the graphics port is no longer a bottleneck. Video cards switched to it very quickly, but the Socket7 platform suffered from compatibility problems almost until the very end. Only the latest chipsets and drivers were able to improve this situation, but even then nuances arose.
And the screws are there!
The time has come for Coppermine, frequencies have increased, performance has increased, new video cards have improved performance and increased pipelines and memory. The computer has already become a multimedia center - they played music and watched movies on it. Integrated sound cards with weak characteristics are inferior to SBLive!, which have become the people's choice. But something prevented complete idyll. What was it?
This factor was hard drives, the growth of which slowed down and stopped at around 40 GB. For movie collectors (then MPEG4), this caused confusion. Soon the problem was solved, and quite quickly - the disks grew in volume to 80 GB and higher and ceased to worry the majority of users.
AMD produces a very good platform - Socket A and a K7 architecture processor, called Athlon by marketers (technical name Argon), as well as the budget Duron. Athlone's strengths were the bus and a powerful FPU, which made it an excellent processor for serious calculations and games, leaving its competitor - the Pentium 4 - the role of office machines, where, however, powerful systems were never required. Early Durons had very low cache size and bus speed, making it difficult to compete with the Intel Celeron (Tualatin). But due to better scalability (due to a faster bus), they responded better to increasing frequencies, and therefore older models were already easily ahead of Intel solutions.
Between two bridges
During this period, two bottlenecks appeared at once. The first is the tire between the axles. Traditionally, PCI has been used for these purposes. It is worth remembering that PCI, as used in desktop computers, has a theoretical throughput of 133 MB/s. In fact, the speed depends on the chipset and application and varies from 90 to 120 MB/s. In addition to this, the bandwidth is shared among all the devices connected to it. If we have two IDE channels with a theoretical throughput of 100 Mb/s (ATA-100) connected to a bus with a theoretical throughput of 133 Mb/s, then the problem is obvious. LPC, PS/2, SMBus, AC97 have low bandwidth requirements. But Ethernet, ATA 100/133, PCI, USB 1.1/2.0 already operate at speeds comparable to the inter-bridge interface. For a long time there was no problem. USB was not used, Ethernet was needed infrequently and mostly at 100 Mbps (12.5 Mbps), and hard drives could not even come close to the interface's maximum speed. But time passed, and the situation changed. It was decided to make a special inter-hub (between bridges) tire.
VIA, SiS and Intel have released their own bus options. They differed, first of all, in their throughput capabilities. They started with PCI 32/66 - 233 Mb/s, but the main thing was done - the PCI bus was allocated only for its own devices, and there was no need to transfer data through it to other buses. This improved the speed of working with peripherals (relative to bridge architecture).
The throughput of the graphics port was also increased. The ability to work with Fast Writes modes was introduced, which made it possible to write data to video memory directly, bypassing system memory, and Side Band Addressing, which used an additional 8-bit part of the bus for transmission, usually intended for transferring technical data. The gain from using FW was achieved only under high processor load; in other cases it gave a negligible gain. Thus, the difference between the 8x mode and 4x was within the error.
CPU dependency
Another bottleneck that emerged, still relevant today, was processor dependence. This phenomenon arose as a result of the rapid development of video cards and meant insufficient power of the “processor - chipset - memory” combination in relation to the video card. After all, the number of frames in the game is determined not only by the video card, but also by this connection, since it is the latter that provides the card with instructions and data that needs to be processed. If the connection does not keep up, then the video subsystem will hit a ceiling determined primarily by it. Such a ceiling will depend on the power of the card and the settings used, but there are also cards that have such a ceiling with any settings in a particular game or with the same settings, but in most modern games with almost any processor. For example, the GeForce 3 card was heavily limited by the performance of the Puntium III and Pentium 4 processors based on the Willamete core. The slightly older GeForce 4 Ti model was already lacking the Athlon 2100+-2400+, and the increase with improved performance of the combination was very noticeable.
How were the performance improved? At first, AMD, taking advantage of the fruits of the developed efficient architecture, simply increased the frequency of processors and improved the technological process, and chipset manufacturers - memory bandwidth. Intel continued to follow the policy of increasing clock frequencies, fortunately the Netburst architecture was designed to do just that. Intel processors based on Willamete and Northwood cores with a 400QPB (quad pumped bus) bus were inferior to competing solutions with a 266 MHz bus. After the introduction of 533QPB, the processors became equal in performance. But then Intel, instead of the 667-MHz bus implemented in server solutions, decided to transfer processors for desktop computers directly to the 800 MHz bus in order to make a reserve of power to compete with the Barton core and the new top Athlon XP 3200+. Intel processors were very limited by the bus frequency, and even 533QPB was not enough to provide a sufficient amount of data flow. That is why the released 3.0 GHz CPU on an 800 MHz bus outperformed the 3.06 MHz processor on a 533 MHz bus in all, with the possible exception of a small number of applications.
Support for new frequency modes for memory was also introduced, and a dual-channel mode appeared. This was done to equalize the bandwidth of the processor and memory bus. Dual-channel DDR mode exactly matched QDR at the same frequency.
For AMD, dual-channel mode was a formality and gave a barely noticeable increase. The new Prescott core did not bring a clear increase in speed and in some places was inferior to the old Northwood. Its main goal was to transfer to a new technical process and the possibility of further increasing frequencies. Heat generation increased significantly due to leakage currents, which put an end to the release of a model operating at a frequency of 4.0 GHz.
Through the ceiling to a new memory
The generation Radeon 9700/9800 and GeForce 5 for processors of that time did not cause problems with processor dependence. But the GeForce 6 generation brought most systems to their knees, since the performance increase was very noticeable, and therefore the processor dependence was higher. Top processors based on Barton (Athlon XP 2500+ - 3200+) and Northwood/Prescott (3.0-3.4 MHz 800FSB) cores have hit a new limit - the memory frequency limit and the bus. AMD especially suffered from this - the 400 MHz bus was not enough to realize the power of a good FPU. The Pentium 4 had a better situation and showed good results at minimum timings. But JEDEC was unwilling to certify higher-frequency, lower-latency memory modules. Therefore, there were two options: either a complex four-channel mode, or switching to DDR2. The latter happened and the LGA775 (Socket T) platform was introduced. The bus remained the same, but memory frequencies were not limited to 400 MHz, but only started from there.
AMD solved the problem better in terms of scalability. The K8 generation, technically called Hammer, in addition to increasing the number of instructions per clock cycle (partly due to a shorter pipeline), had two innovations with a reserve for the future. They were the built-in memory controller (or rather, the north bridge with most of its functionality) and the fast universal HyperTransport bus, which served to connect the processor with the chipset or processors with each other in a multiprocessor system. The built-in memory controller made it possible to avoid the weak link - the chipset-processor connection. FSB as such ceased to exist, there was only a memory bus and an HT bus.
This allowed Athlon 64 to easily outperform existing Intel solutions based on the Netburst architecture and show the flawed ideology of a long pipeline. Tejas had a lot of problems and did not come to light. These processors easily realized the potential of GeForce 6 cards, just like the older Pentium 4.
But then an innovation appeared that made processors a weak link for a long time. Its name is multi-GPU. It was decided to revive the ideas of 3dfx SLI and implement them in NVIDIA SLI. ATI responded symmetrically and released CrossFire. These were technologies for processing scenes using two cards. The doubled theoretical power of the video subsystem and calculations associated with splitting the frame into parts at the expense of the processor led to a skewed system. The older Athlon 64 loaded such a combination only in high resolutions. The release of GeForce 7 and ATI Radeon X1000 further increased this imbalance.
Along the way, a new PCI Express bus was developed. This bidirectional serial bus is designed for peripherals and is very fast. It replaced AGP and PCI, although it did not completely supplant it. Due to its versatility, speed and low cost of implementation, it quickly replaced AGP, although at that time it did not bring any increase in speed. There was no difference between them. But from the point of view of unification, this was a very good step. Boards are now being produced that support PCI-E 2.0, which has twice the throughput (500 MB/s in each direction versus the previous 250 MB/s per line). This also did not provide any gains to current video cards. The difference between different PCI-E modes is only possible in the case of insufficient video memory, which already means an imbalance for the card itself. Such a card is the GeForce 8800GTS 320 MB - it reacts very sensitively to changes in the PCI-E mode. But taking an unbalanced card just to evaluate the gain from PCI-E 2.0 is not the most reasonable decision. Another thing is cards with support for Turbocache and Hypermemory - technologies for using RAM as video memory. Here the increase in memory bandwidth will be approximately twofold, which will have a positive effect on performance.
You can see whether the video card has enough memory in any review of devices with different VRAM sizes. Where there will be a sharp drop in frames per second, there is a lack of VideoRAM. But it happens that the difference becomes very noticeable only in non-playable modes - resolution 2560x1600 and AA/AF at maximum. Then the difference between 4 and 8 frames per second will be twofold, but it is obvious that both modes are impossible in real conditions, and therefore they should not be taken into account.
A new answer to video chips
The release of the new Core 2 architecture (technical name Conroe) improved the situation with processor dependence and loaded solutions on the GeForce 7 SLI without any problems. But Quad SLI and GeForce 8 arrived in time and took revenge, restoring the imbalance. This continues to this day. The situation only got worse with the release of 3-way SLI and the upcoming Quad SLI on GeForce 8800 and Crossfire X 3-way and 4-way. The release of Wolfdale slightly increased the clock speeds, but overclocking this processor is not enough to properly load such video systems. 64-bit games are very rare, and growth in this mode is observed in isolated cases. The games that benefit from four cores can be counted on the fingers of one disabled hand. As usual, Microsoft is pulling everyone out, loading up their new OS and memory, and the processor is doing great. It is implicitly announced that 3-way SLI and Crossfire X technologies will work exclusively under Vista. Given its appetites, gamers may be forced to take quad-core processors. This is due to a more uniform load of kernels than in Windoes XP. If it must eat up a fair share of processor time, then at least let it eat up the cores that are not used by the game anyway. However, I doubt that the new operating system will be satisfied with these kernels.
The Intel platform is becoming obsolete. The four cores are already suffering greatly from lack of memory bandwidth and delays associated with bus switches. The bus is shared, and it takes time for the kernel to take control of the bus. With two cores this is tolerable, but with four cores the effect of temporary losses becomes more noticeable. Also, the system bus has not kept up with bandwidth for a long time. The influence of this factor was weakened by improving the efficiency of the asynchronous mode, which Intel implemented well. Workstations suffer from this to an even greater extent due to the fault of the unsuccessful chipset, the memory controller of which provides only up to 33% of the theoretical memory bandwidth. An example of this is the loss of the Intel Skulltrail platform in most gaming applications (3Dmark06 CPU test is not a gaming application :)) even when using the same video cards. Therefore, Intel announced a new generation of Nehalem, which will implement an infrastructure very similar to AMD's developments - an integrated memory controller and a QPI peripheral bus (technical name CSI). This will improve platform scalability and provide positive results in dual-processor and multi-core configurations.
AMD currently has several bottlenecks. The first is related to the caching mechanism - because of it, there is a certain bandwidth limit, depending on the processor frequency, such that it is not possible to jump above this value, even using higher frequency modes. For example, with an average processor the difference in working with memory between DDR2 667 and 800 MHz can be about 1-3%, but for a real task it is generally negligible. Therefore, it is best to select the optimal frequency and lower the timings - the controller responds very well to them. Therefore, it makes no sense to implement DDR3 - high timings will only hurt, and there may be no gain at all. Also, AMD’s problem now is the slow (despite SSE128) processing of SIMD instructions. It is for this reason that Core 2 is very much ahead of K8/K10. ALU, which has always been Intel's strong point, has become even stronger, and in some cases can be many times faster than its counterpart in Phenom. That is, the main problem with AMD processors is weak “mathematics”.
Generally speaking, weak links are very task specific. Only “epoch-making” ones were considered. So, in some tasks, the speed may be limited by the amount of RAM or the speed of the disk subsystem. Then more memory is added (the amount is determined using performance counters) and RAID arrays are installed. The speed of games can be increased by disabling the built-in sound card and purchasing a normal discrete one - Creative Audigy 2 or X-Fi, which load the processor less by processing effects with their chip. This applies to a greater extent to AC’97 sound cards and to a lesser extent to HD-Audio (Intel Azalia), since the latter has fixed the problem of high processor load.
Remember, the system should always be tailored to specific tasks. Often, if you can choose a balanced video card (and the choice according to price categories will depend on prices that vary greatly in different places), then, say, with a disk subsystem such an opportunity is not always available. Very few people need RAID 5, but for a server it is an indispensable thing. The same applies to a dual-processor or multi-core configuration, useless in office applications, but a “must have” for a designer working in 3Ds Max.